
gnuplotはフリーでグラフを作成できるソフトウェアになります。
gnuplotの読み方は"new"+"plot"(ニュープロット)であり、gnuplotの開発者たちは当初、「newplot」と命名したかったそうですが既に開発者たちの職場に同じ名前のプログラムがあったようなので、newと同じ発音のgnuを用いた洒落た名前としてgnuplotとしたそうです。また、ニュープロットではなく、グニュープロットと読む人もいます。
gnuは牛に似た動物のヌーのことを意味する単語になります。GNU projectのGNUのスペルとはたまたまダブったものになります。
gnuplotはGNU projectではなく独自のプロジェクトで、ライセンスもGPLではなく、独自のフリーソフトウェアライセンスが用いられています。
目次
インストール
ここで利用するgnuplotはaptからからパッケージをインストールしたものを利用します。
|
1 |
sudo apt install gnuplot |
利用している環境としてUbuntu(Desktop版)とgnuplotのバージョンは以下のようになります。
|
1 2 3 4 5 6 7 |
$ lsb_release -a 2>/dev/null Distributor ID: Ubuntu Description: Ubuntu 23.04 Release: 23.04 Codename: lunar $ gnuplot -V gnuplot 5.4 patchlevel 4 |
gnuplotのサンプルデモ
gnuplotのソースコードの中にdemosというディレクトリがあり、その中にはgnuplotの多くのサンプルスクリプトがあります。
Web上でもサンプルを見ることができますが、手元で動作するサンプルを持っておくと使いたいグラフの参考やテンプレートとして利用できるため、ソースコードをダウンロードしても良いと思います。
ソースコードは公式サイトからgithub等からダウンロードすることができます。また、前設定が少し必要かもしれませんがapt-get sourceコマンド等でソースコードをダウンロードする方法もあります。
gnuplotの起動
gnuplotはファイルを指定して実行できます。
ファイルを指定しない場合、gnuplotは対話的なモードで起動します。この対話的なモードはexitコマンドで終了できます。
|
1 2 3 4 5 6 7 8 9 10 11 12 13 14 15 |
$ gnuplot G N U P L O T Version 5.4 patchlevel 4 last modified 2022-07-10 Copyright (C) 1986-1993, 1998, 2004, 2007-2022 Thomas Williams, Colin Kelley and many others gnuplot home: http://www.gnuplot.info faq, bugs, etc: type "help FAQ" immediate help: type "help" (plot window: hit 'h') Terminal type is now 'qt' gnuplot> exit $ |
ファイルを指定するとそのファイルから読み込んで実行します。複数のファイルを指定するとファイルを順番に読み込んで実行していき、最後までファイルを読み込むとgnuplotは終了します。
コマンド例と実行結果
|
1 2 3 4 5 |
$ ls data.dat simplegraph.gp $ gnuplot simplegraph.gp $ ls data.dat ex1.png simplegraph.gp |
simplegraph.gp
|
1 2 3 4 5 6 7 8 9 10 11 12 13 14 15 16 |
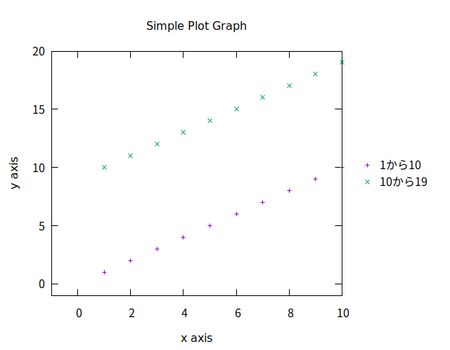
set terminal pngcairo set output "simplegraph.png" set title "Simple Plot Graph" set xrange [-1:10] set xtic 2 set xlabel "x axis" set yrange [-1:20] set ytic 5 set ylabel "y axis" set key outside right center reverse Left samplen 1 plot "data.dat" using 1:2 title "1から10", "" using 1:3 title "10から19" |
data.dat
|
1 2 3 4 5 6 7 8 9 10 |
1 1 10 2 2 11 3 3 12 4 4 13 5 5 14 6 6 15 7 7 16 8 8 17 9 9 18 10 10 19 |
出力形式と出力先ファイルの設定
出力端末はset terminalで設定できます。これは対話的なウインドウや出力するファイルの種類のための出力形式を指定します。
set terminalの引数を省略した場合は利用できる出力形式を表示できます。show terminalで現在の出力形式の設定を確認できます。
|
1 2 |
set terminal {<terminal-type> | push | pop} show terminal |
よく利用される出力形式として対話的なウインドウでは
qt :QTを利用したクロスプラットフォームのディスプレイ
wxt :WxWidgetを利用したクロスプラットフォームのディスプレイ
x11 :UNIX系のディスプレイ
windows :Windowsのディスプレイ
があります。
また、ファイル出力のための出力形式では、
pdfcairo, pngcairo, epscairo等: cairoとpangoライブラリを利用
png, jpeg, gif等: libgdライブラリを利用
があります。利用されているライブラリの違いによって、描画やフォントの処理に違いが現れます。
面白い出力形式としてdumbもあります。これは端末上にグラフを出力する形式で以下のように出力できます。
|
1 2 3 4 5 6 7 8 9 10 11 12 13 14 15 16 17 18 19 20 21 22 23 24 25 26 27 28 29 30 31 32 33 34 35 36 37 38 39 40 41 42 43 44 45 46 47 48 49 50 51 52 53 54 55 56 57 |
gnuplot> set terminal dumb Terminal type is now 'dumb' Options are 'feed size 79, 24 aspect 2, 1 mono' gnuplot> plot sin(x) 1 +--------------------------------------------------------------------+ | * * + * ** + * * | 0.8 |-+ * * * * sin(x* *******-| | * * * * * * | 0.6 |-+ * * * * * * +-| | * * * * * * | 0.4 |*+ * * * * * *+-| |* * * * * * * | 0.2 |*+ * * * * * *+-| | * * * * * * * | 0 |-* * * * * * *-| | * * * * * * *| -0.2 |-+* * * * * * +*| | * * * * * * *| -0.4 |-+* * * * * * +*| | * * * * * * | -0.6 |-+ * * * * * * +-| | * * * * * * | -0.8 |-+ * * * * * * +-| | * * + ** * + * * | -1 +--------------------------------------------------------------------+ -10 -5 0 5 10 gnuplot> plot '< seq 1 100' with lines 100 +--------------------------------------------------------------------+ | + + + + + + + + +**** | 90 |-+ '< seq 1 100'********-| | *** | 80 |-+ **** +-| | *** | 70 |-+ **** +-| | **** | 60 |-+ **** +-| | **** | 50 |-+ **** +-| | **** | 40 |-+ *** +-| | **** | 30 |-+ *** +-| | **** | 20 |-+ *** +-| | **** | 10 |-+ **** +-| |**** + + + + + + + + + | 0 +--------------------------------------------------------------------+ 0 10 20 30 40 50 60 70 80 90 100 gnuplot> |
出力先の設定はset outputで設定できます。引数を省略した場合は標準出力に設定され、show outputで現在の出力先を確認できます。
|
1 2 |
set output {"<filename>"} show output |
plotコマンドの構文と線を引く
plotコマンド構文はgnuplotのドキュメントより
|
1 2 3 4 5 6 7 |
plot {<ranges>} <plot-element> {, <plot-element>, <plot-element>} plot-element: {<iteration>} <definition> | {sampling-range} <function> | <data source> | keyentry {axes <axes>} {<title-spec>} {with <style>} |
のようになります。定義(definition)、関数(function)、データ(data source)は描画するグラフのデータ指定を行い、keyentryは凡例の行を増やすことができます。
keyという単語は鍵という意味を思い浮かぶ人もいるかもしれませんが、グラフの用語では凡例を意味する単語でもあります。
この構文の中でこの記事でよく利用する形式は、
|
1 2 3 4 |
plot <plot-element> {, <plot-element>, <plot-element>} plot-element: <data source> {<title-spec>} {with <style>} |
になります。
また、データファイルを利用したplotコマンドの構文は同じくgnuplotのドキュメントより
|
1 2 3 4 5 6 7 8 9 |
plot '<file_name>' {binary <binary list>} {{nonuniform} matrix} {index <index list> | index "<name>"} {every <every list>} {skip <number-of-lines>} {using <using list>} {smooth <option>} {bins <options>} {volatile} {noautoscale} |
のようになります。usingはデータ列の選択に利用します。他のものの詳しい内容については省略させてもらいます。
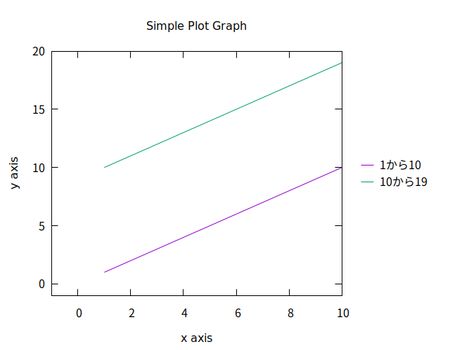
plotコマンドで線を引きたい場合は、withでlinesを指定すると線を引くことができます。
plotコマンドの例
|
1 2 |
plot "data.dat" using 1:2 title "1から10" with lines, \ "" using 1:3 title "10から19" with lines |
行の末尾に"\"を入れることでコマンドを複数行にすることができます。
また、ファイルの指定を空文字列にすると前回指定したファイルを再利用できます。
コマンド例と実行結果
|
1 2 3 4 5 |
$ ls data.dat lines.gp $ gnuplot lines.gp $ ls data.dat lines.gp lines.png |
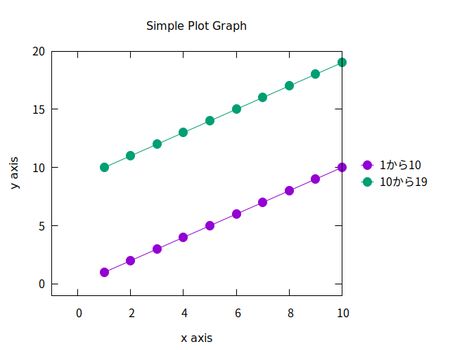
線を引くと同時に点も入れたい場合は、withでlinespointsを指定すると線を引くと同時に点を入れることができます。
plotコマンドの例
|
1 2 |
plot "data.dat" using 1:2 title "1から10" with linespoints pointtype 7 pointsize 2, \ "" using 1:3 title "10から19" with linespoints pt 7 ps 2 |
凡例(key)の構文と設定の確認
凡例にかかわる構文はgnuplotのドキュメントより以下のようなものがあります。詳しい内容に関してはドキュメントの方を参照してください。
凡例のグローバルオプション
|
1 2 3 4 5 6 7 8 |
set key {on|off} {default} {font "<face>,<size>"} {{no}enhanced} {{no}title "<text>" {<font or other text options>}} {{no}autotitle {columnheader}} {{no}box {<line properties>}} {{no}opaque {fc <colorspec>}} {width <width_increment>} {height <height_increment>} unset key |
凡例の配置オプション
|
1 2 3 4 5 |
set key {inside | outside | fixed} {lmargin | rmargin | tmargin | bmargin} {at <position>}} {left | right | center} {top | bottom | center} {offset <dx>,<dy>} |
凡例のレイアウトオプション
|
1 2 3 4 5 6 7 8 9 10 11 |
set key {vertical | horizontal} {maxcols {<max no. of columns> | auto}} {maxrows {<max no. of rows> | auto}} {columns <exact no. of columns>} {keywidth [screen|graph] <fraction>} {Left | Right} {{no}reverse} {{no}invert} {samplen <sample_length>} {spacing <line_spacing>} {width <width_increment>} {height <height_increment>} {title {"<text>"} {{no}enhanced} {center | left | right}} {font "<face>,<size>"} {textcolor <colorspec>} |
show keyを用いると凡例の設定の確認を行うことができます。
設定の確認
|
1 2 3 4 5 6 7 8 9 10 11 12 13 |
gnuplot> show key key is ON, position: top right vertical fixed key is right justified, not reversed, not inverted, enhanced and not boxed sample length is 4 characters vertical spacing is 1 characters width adjustment is 0 characters height adjustment is 0 characters curves are automatically titled with filename maximum number of columns is calculated automatically maximum number of rows is calculated automatically key title is "" |
省略形
コマンドの省略形
コマンドは曖昧にならない程度に先頭にある文字で省略を行うことができます。
例として
plot -> p
using -> u
with -> w
lines -> l
のように省略できます。
コマンドを省略した例
|
1 2 |
f(x)=2*x p "< seq 1 10" u 1:1 w l, "" u 1:(f($1)) w l |
withの構文とその他の省略形
単語の頭文字同士を組み合わせた省略形になっているものもあります。これらの多くはwithで利用されることが多いです。
withの構文はgnuplotのドキュメントより
|
1 2 3 4 5 6 7 8 9 10 11 |
with <style> { {linestyle | ls <line_style>} | {{linetype | lt <line_type>} {linewidth | lw <line_width>} {linecolor | lc <colorspec>} {pointtype | pt <point_type>} {pointsize | ps <point_size>} {arrowstyle | as <arrowstyle_index>} {fill | fs <fillstyle>} {fillcolor | fc <colorspec>} {nohidden3d} {nocontours} {nosurface} {palette}} } |
のようになっています。詳しい内容についてはgnuplotのドキュメントを参照してください。
空のファイル名とパイプからの入力
空のファイル名を指定すると直前のファイル名を再利用することができます。
また、popen関数が働くシステムでは、最初に"<"の文字を入れることで、シェルコマンドからパイプ入力を行うことができます。
command_abbreviation.gp
|
1 2 3 4 5 6 7 |
set terminal pngcairo set output "command_abbreviation.png" unset key f(x)=2*x p "< seq 1 10" u 1:1 w l, "" u 1:(f($1)) w l |
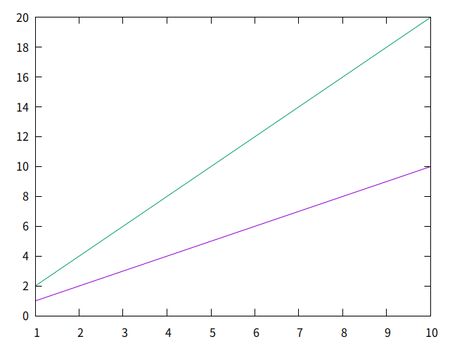
fdopen関数が働くシステムでは、"<&n"でn番目のファイルディスクリプタを用いて入力を行うことができます。
これにより、1回のシェルコマンドの呼び出しで複数のデータファイルからのパイプ入力が容易になります。
|
1 |
$ gnuplot -p -e 'plot "<&3","<&4"' 3< <(seq 1 10) 4< <(seq 11 20) |
"<(command)"はシェルの機能にあるプロセス置換といいます。プロセスの入力をファイル名として扱うことができます。
データ列の選択(using)
usingは
|
1 |
plot 'file' using <entry> {:<entry> {:<entry> ...}} {'format'} |
のように利用します。'format'はこの記事では利用しませんが、C言語のscanf関数のようにデータを読み取ることができます。
<entry>は
- フィールド選択のための単なる列番号 ex)1,2,3,…
- 先頭行の列ラベルの文字列 ex) "Age", "Height" 等
- 括弧で囲んだ数式 ex) ($2+$3), ($2>10 ? $2 : $3), (f($1)) 等
- 括弧で囲まなくてよい特別な関数 ex) xticlabels(2) 等
になります。
括弧で囲んだ数式を用いる場合、列の値はcolumn(1)のように指定でき、その略記が$1, $2になります。
<entry>が2つある場合は、<xの値>:<yの値>のように扱われます。
エラーバー等を用いると3つ以上の<entry>を用いることもあります。
using 1のような<entry>が1つの場合は、その<entry>はyの値として扱われ、using 0:1と同じ意味になります。
0は疑似列で、gnuplotがデータに対して自動的に連番を振った値になります。
データ列から凡例名を取得
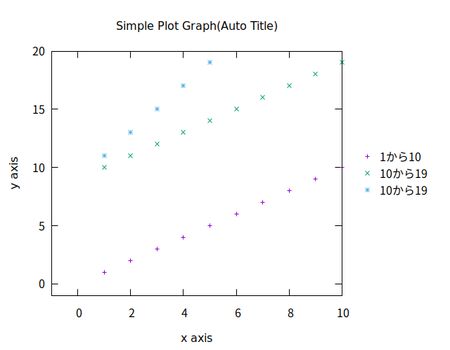
set key autotitle columnheaderを用いるとデータファイルの先頭行を凡例のとして用いることができます。
また、columnhead関数を用いると指定した列の名前を取得することができます。2つ以上の列の計算を用いた場合等に利用すると便利です。
autotitle.gp
|
1 2 3 4 5 6 7 8 9 10 11 12 13 14 15 16 17 18 19 |
set terminal pngcairo set output "autotitle.png" set title "Simple Plot Graph(Auto Title)" set xrange [-1:10] set xtic 2 set xlabel "x axis" set yrange [-1:20] set ytic 5 set ylabel "y axis" set key outside right center reverse Left samplen 1 set key autotitle columnheader plot "data_key.dat" using 1:2, \ "" using 1:3, \ "" using 1:($2+$3) title columnhead(3) |
data_key.dat
|
1 2 3 4 5 6 7 8 9 10 11 |
x 1から10 10から19 1 1 10 2 2 11 3 3 12 4 4 13 5 5 14 6 6 15 7 7 16 8 8 17 9 9 18 10 10 19 |
コマンド例
|
1 |
$ gnuplot autotitle.gp |
testコマンド
'test'または'test terminal'は設定されているterminalでサポートしている線や点のスタイル等を網羅的に確認できます。
点や線のスタイルとその色の番号が一緒になっていて簡潔に表示されている点は少し気を付けるべきかもしれません。
また、'test palette'は現在の色の設定'palette'を確認できます。
コマンドラインオプション
gnuplotコマンドのコマンドラインオプションを一部紹介します。
プログラム終了後もプロットウインドウを維持(-pオプション)
-p(--persist)オプションは、gnuplotのプログラムが終了した後でもプロットウインドウが終了しません。
ファイルを読み込む前にコマンドを実行(-eオプション)
-eオプションはファイルを読み込む前にコマンドを実行できます。